Product
Features
Products
Holistics.io - BI Reporting As CodeDefine reusable analytics logic. Build reports and metrics using code. Version control with Git. Design and publish datasets for self-serve exploration.Docs
Community
Resources
Data lineage
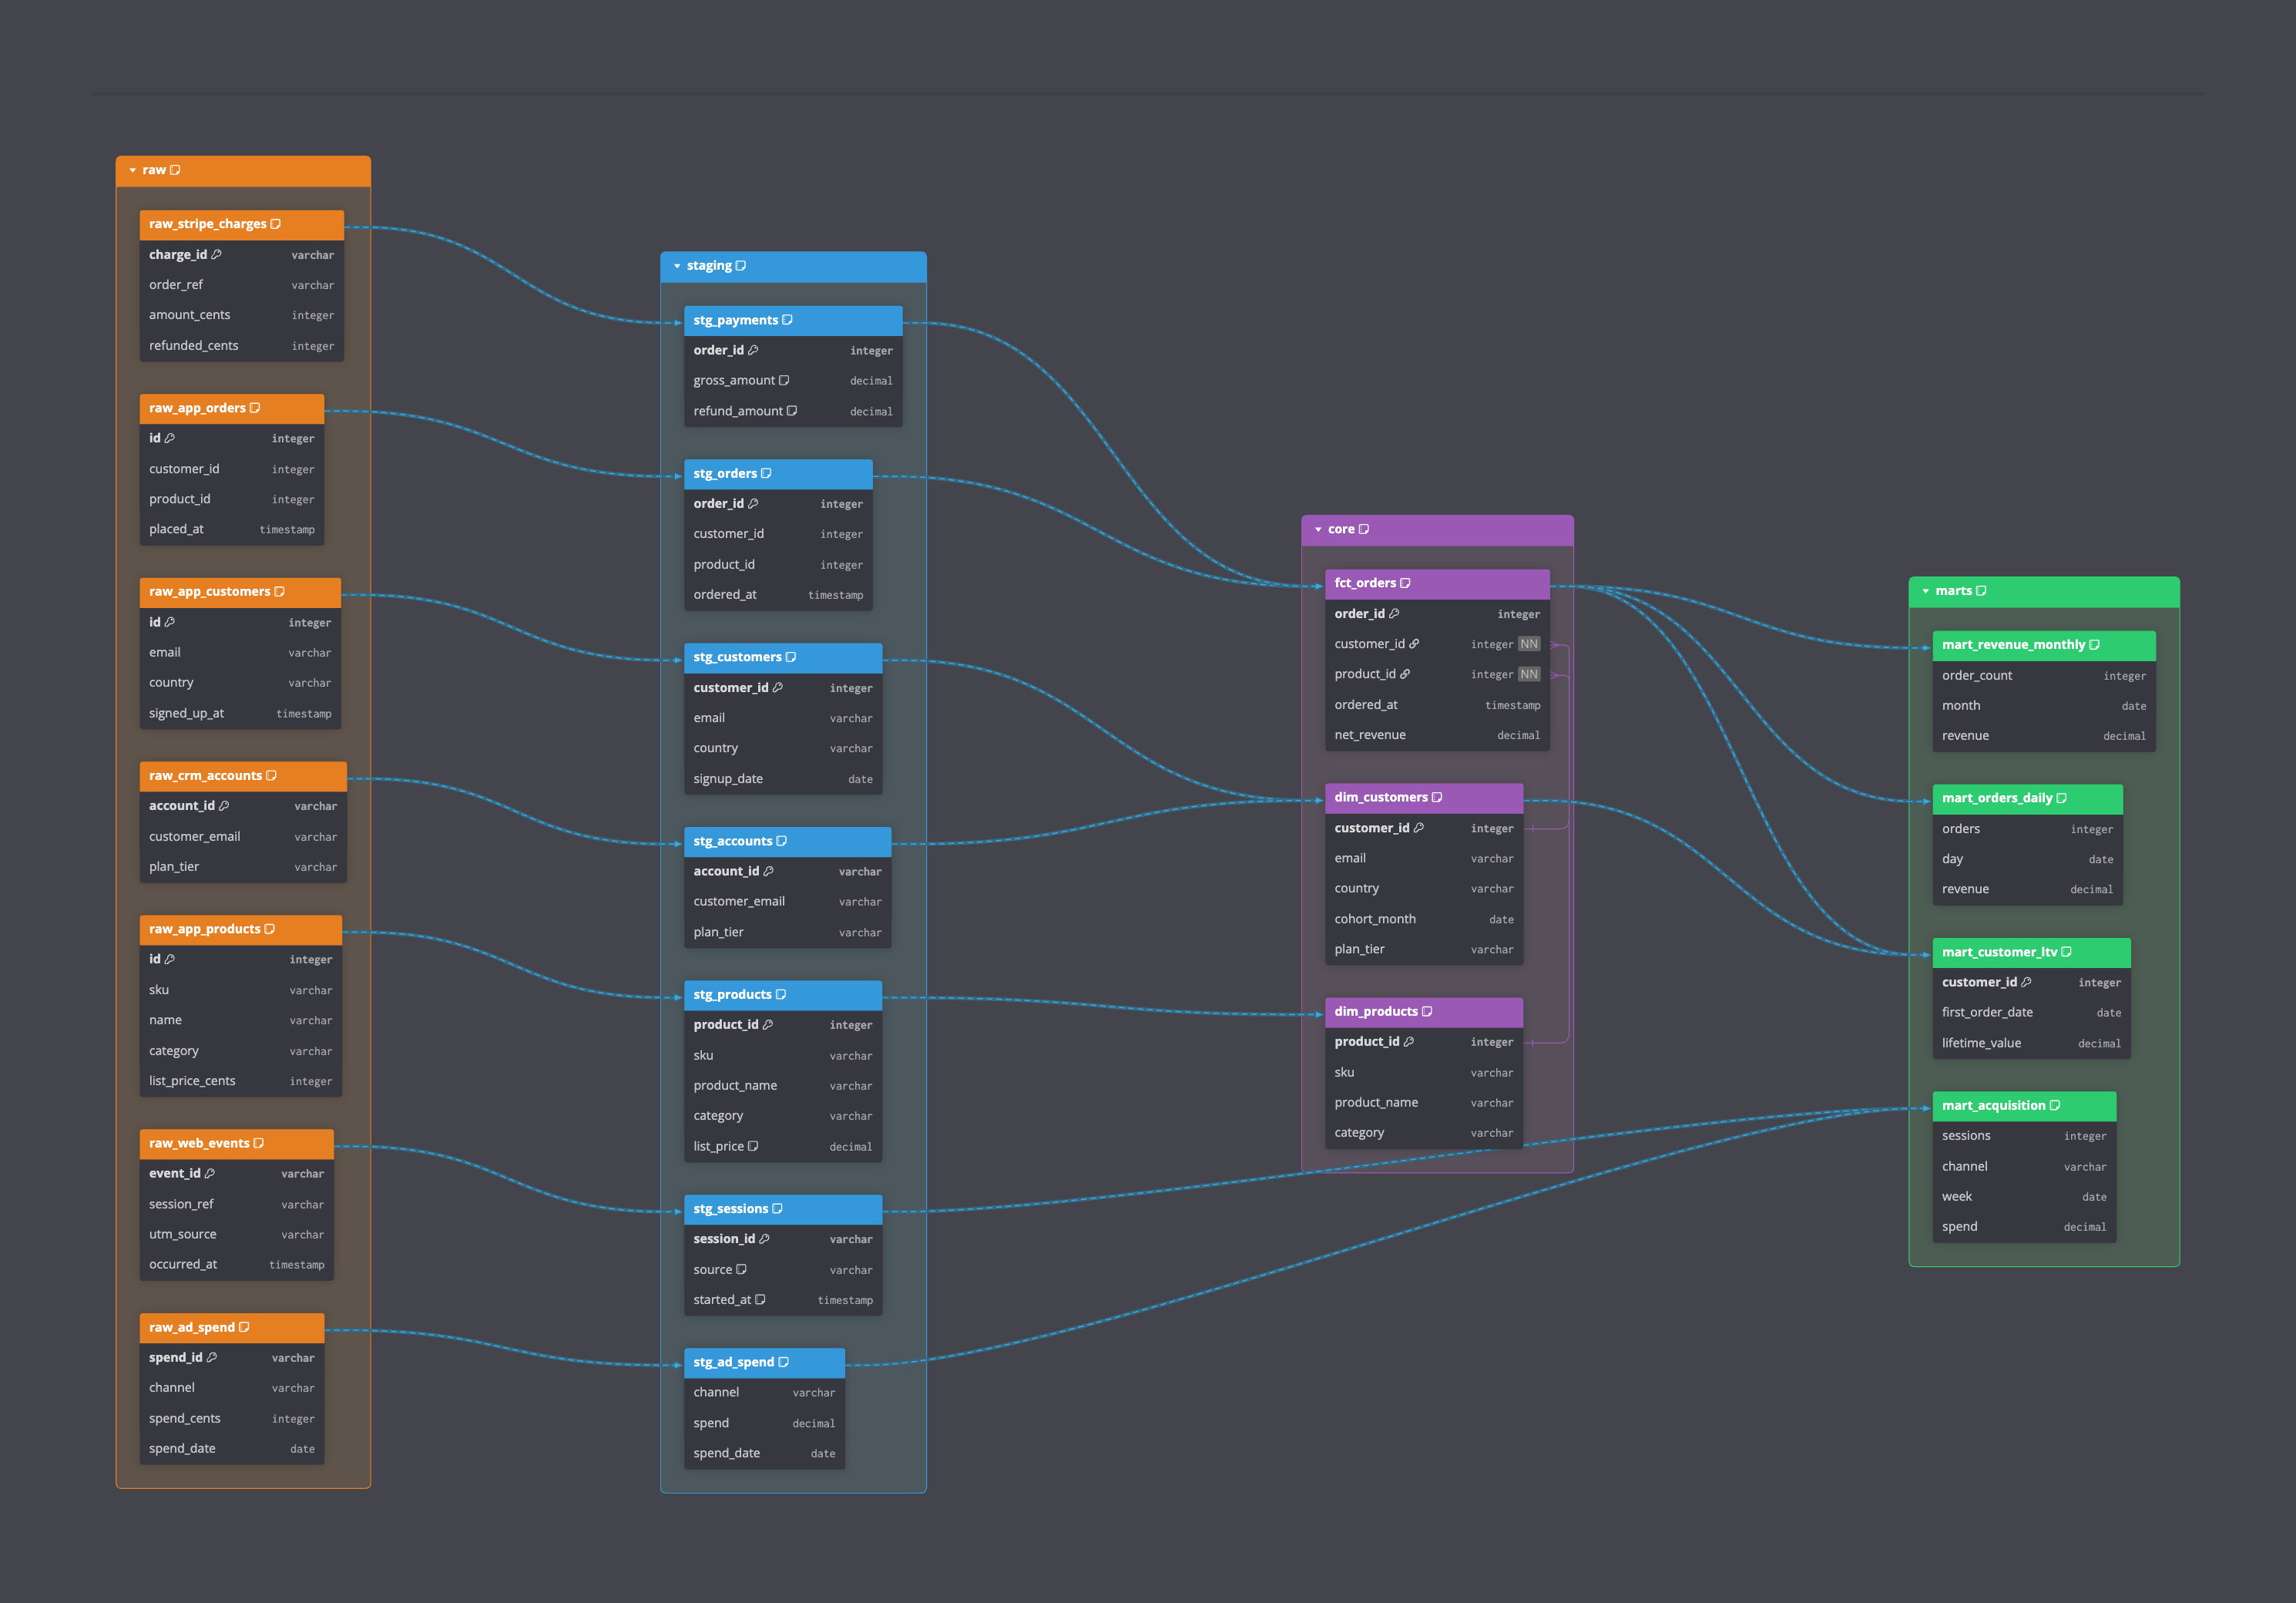
Describe your pipeline in DBML, a plain text language for data models. dbdiagram draws the flow from source to mart as you type. Built for data teams.
A Dep says one table or column is built from another. Point one table at another for a quick DAG, or list the columns to say which field feeds which.
// table-level: a quick DAG Dep: raw_stripe -> stg_orders // column-level, with a note on the transform Dep { stg_orders.amount -> fct_orders.amount stg_orders.status -> fct_orders.state note: 'Keeps paid orders. Renames status to state.' } // inline on the target column Table fct_orders { amount decimal [dep: <- stg_orders.amount] }
Foreign-key relationships (Ref) and data lineage (Dep) draw as different edge styles on the same canvas. Show them together or separately, whichever the diagram needs.

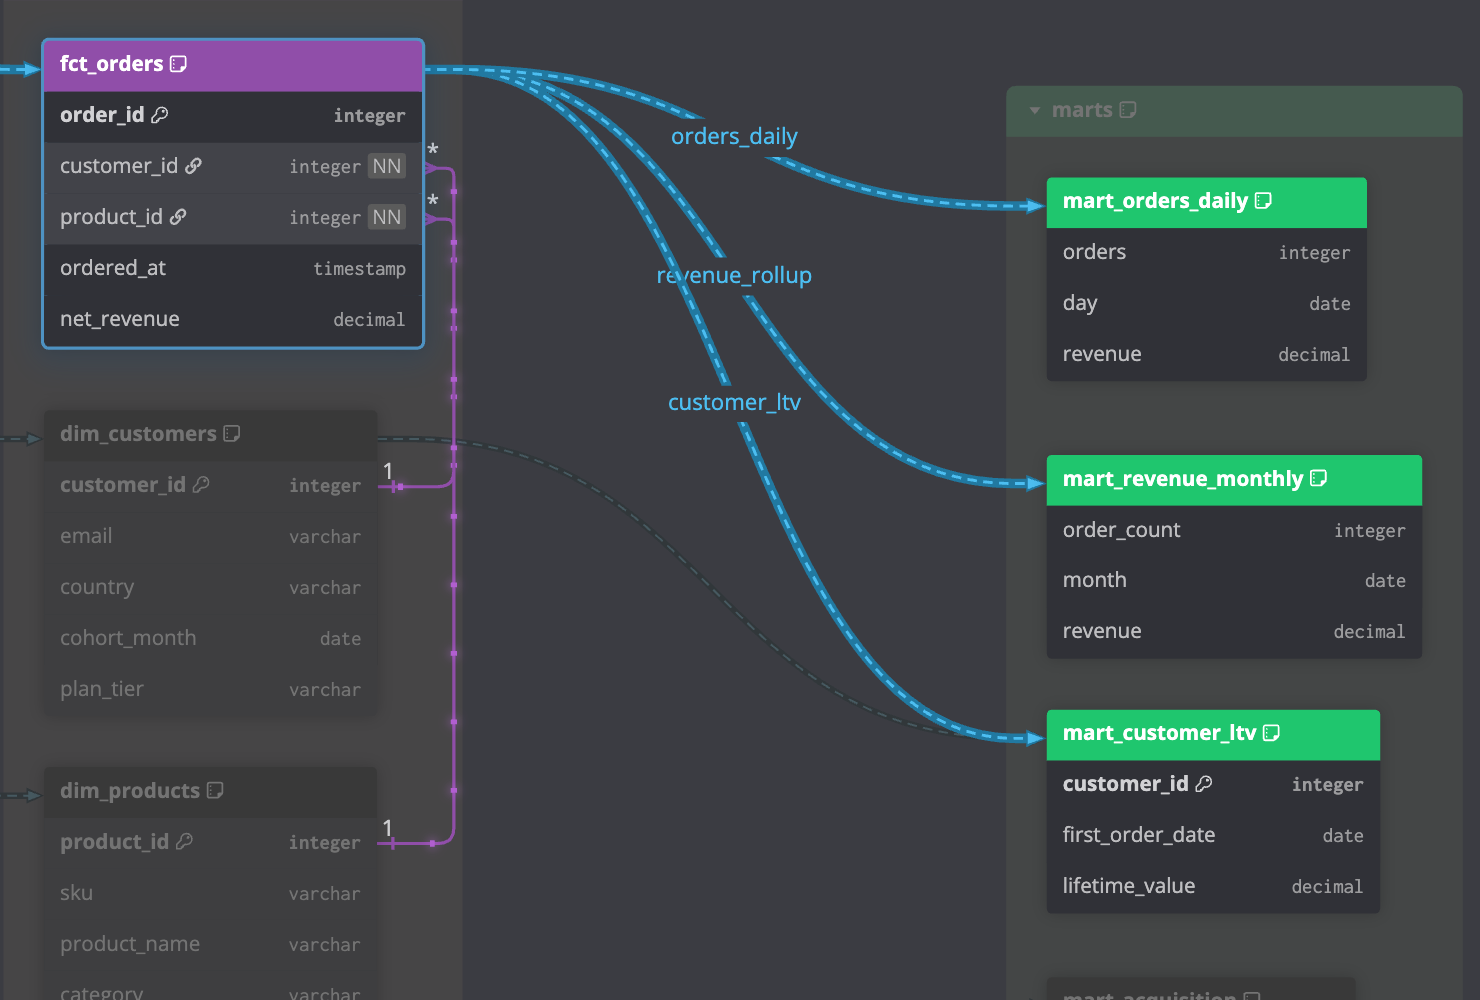
Map dependencies column by column. Click a field in a mart and dbdiagram highlights its whole path. You see every model it passes through and the transform recorded at each step.
Put models into color-coded groups by layer, for example sources, staging and marts (the medallion pattern). The groups come from your DBML, so a large pipeline stays readable as it grows.
See layer grouping
Map out a pipeline and share it for feedback before you write any SQL. Changing the design costs nothing at that stage.
Publish a link or embed the live diagram in Notion, Confluence or a README. Teammates open it in the browser with nothing to install.
Your pipeline is already defined somewhere. Generate the diagram from a dbt project or your warehouse, instead of retyping it by hand.
Point dbdiagram at a dbt project. It reads your models, sources and ref() calls and draws the lineage. Change a model and preview the diff before you ship it.
Connect a database and dbdiagram reads your views and materialized views as derived models. The dependencies between them become flow edges.
Does it show column-level lineage?
Yes. Map dependencies column by column, like stg_orders.amount -> fct_orders.amount. You can then trace one field from mart back to source, not just table to table.
How is this different from dbt docs?
dbt docs needs a warehouse connection to generate, and only shows the pipeline once it's built. dbdiagram draws the flow straight from code, so you can design and review it before the SQL exists.
Can I document the transform logic?
Yes. Attach a note to any Dep, including the SQL and how the model is materialized. The transform then sits next to the lineage it produces.
Do I need to connect my warehouse?
No. You write lineage in DBML in the editor. Connecting a database to extract views automatically is an optional path we are building.
Do I need to know DBML?
If you have used dbdiagram, you already know most of it. Lineage adds one block, Dep, next to the Table and Ref syntax you already write. If you are new, it is a small language you can pick up in minutes.
Is it free?
Yes. Writing and visualizing your lineage is free, with no limit on project size. Paid plans add advanced visualization for large diagrams, plus live connections to your warehouse or dbt project with change diffs. See pricing .
Write your first Dep in the editor. It takes a minute.